
Live Sound International: Nov/Dec 2002
PREDICTING ARRAY PERFORMANCE
Back in the “good old days” predicting the performance of a group of loudspeakers was a hit and miss proposition. We tried to hit all the people and miss the walls. We were happy if we had enough devices to point a transducer everywhere that needed coverage and enough power to make it good and loud. Complex interactions between devices operating in the same bandwidth, fine level adjustments for individual devices and precise flying angles were the least of our worries. And even if we were worried about such things we didn’t have the tools to deal with them. Then came the digital revolution.
With the advent of abundant computer horsepower, remote amplifier control and DSP our capacity to exercise control over sound system parameters took quantum leaps. At the same time improvements in test equipment allowed manufacturers to give us meaningful data on the performance of the loudspeakers we were driving. This data combined with the processing power of the modern personal computer made it possible to actually (GASP!) predict the performance of an array before it was hung.
Mark IV (read: Electrovoice, KT, Midas & Altec) was one of the first companies to bring some of these tools to the masses. Their AcoustaCADD program was an early example of sound system modeling software. They also developed a program called Hang Ten to help Electrovoice MT-4 owners figure out where to attach flying straps to get the boxes to array properly. And anyone who has herked MT-4’s around knows that experimenting with different configurations in the real world just wasn’t that much fun. Later EV produced a program called ArrayShow, which was extremely useful for demonstrating the summing and cancellation between adjacent cabinets hung or stacked in close proximity. (See Figure 1.1) Bose also had their Modeler software. But these products were manufacturer specific which limited their usefulness. The next breakthrough came with the introduction of EASE.
Although EASE has a distribution agreement with Renkus-Heinz, it’s speaker database is an unrestricted club. Anyone can join by testing their speakers in a specific manner and submitting the data in the proper form. The speaker data consists of polar patterns generated in one or one-third octave bands at ten degree or five degree angles depending on the version of EASE that it was generated for. In the newest version (4.0) the data for line arrays is produced using impulse response measurements and stored in DLL’s That can model extremely complicated cabinet interactions. Almost all of the reputable manufacturers have basic cabinet data available on their web sites and product CD’s. This allows the system designer to pick and choose different cabinets for different applications, mix manufacturers or even, in the case of some of the big dogs, generate EASE data for their proprietary boxes. We can use this data to predict coverage and SPL levels in a room, set delay times and volume levels of specific cabinets and even to model complex interactions between devices. EASE also does acoustical predictions including reverb time and intelligibility estimates. For the audio consultant who has time to painstakingly draw a room and insert all of the appropriate wall and ceiling treatments this is a great tool. But does this really apply to the touring community?
The line array craze has managed to drag some of us kicking and screaming into the world of predictive software. Line arrays only behave like line arrays are supposed to behave when the cabinets interact properly. The “hang and bang” approach leads to extremely uneven results in the real world. So almost all of the manufacturers fielding these products have created some software to assist their users. (See Figure 1.2) These are not true modeling packages because, with a few exceptions, they only help you determine vertical splay angles needed to cover angled floors, balconies and the like. The horizontal coverage of most line arrays is a fixed quantity. And level prediction with a line array is frequency dependent in the far field. The point at which we go from the vaunted 3dB loss per doubling of distance to typical inverse square law behavior (6dB loss per doubling of distance) changes with frequency, making broadband SPL predictions difficult.
But for most of us using traditional cabinets in traditional clusters there are some very useful tools out there for making sure we hang what we need to hang and point it where it needs to point. The program I have been using recently is one called LARA from Integral Acoustics. It uses EASE data so most commercially made boxes can be imported. It has a convenient library of preconstructed rooms that correspond to most of the typical venues we encounter. They are easily modified to reflect the exact dimensions of a particular space. Defining acoustical treatments is not necessary because LARA treats all surfaces as a perfect absorber. In other words we are only modeling direct field coverage and not trying to predict how the sound system and the room will interact so the time required to build a room is reduced to a minimum. For the well-prepared FOH engineer many of the venues have floor plans available on the web. For those that don’t getting room dimensions can become part of advancing the show. But even if none of the information is available in advance this program is so quick that a room can be modeled on site while the truck is being unloaded.
Once the room is built there are a couple of ways to drop the sound system into the model. There is a library function where you can store all of the cabinet models you are carrying. The speaker locations are chosen by using simple X-Y-Z coordinates. You can build a cluster one cabinet at a time or use predesigned blocks of speakers that you have defined as clusters. If you build the array with individual boxes you can change the pitch, roll and azimuth of each box independently. If you build with clusters you must change parameters for the whole unit. Each box or cluster can also be adjusted for output volume and delay. A chart is generated showing the exact location, height, tilt, volume and delay parameters for each box or cluster. This makes it a snap to put everything where and how it was modeled. (See Figure 1.3)
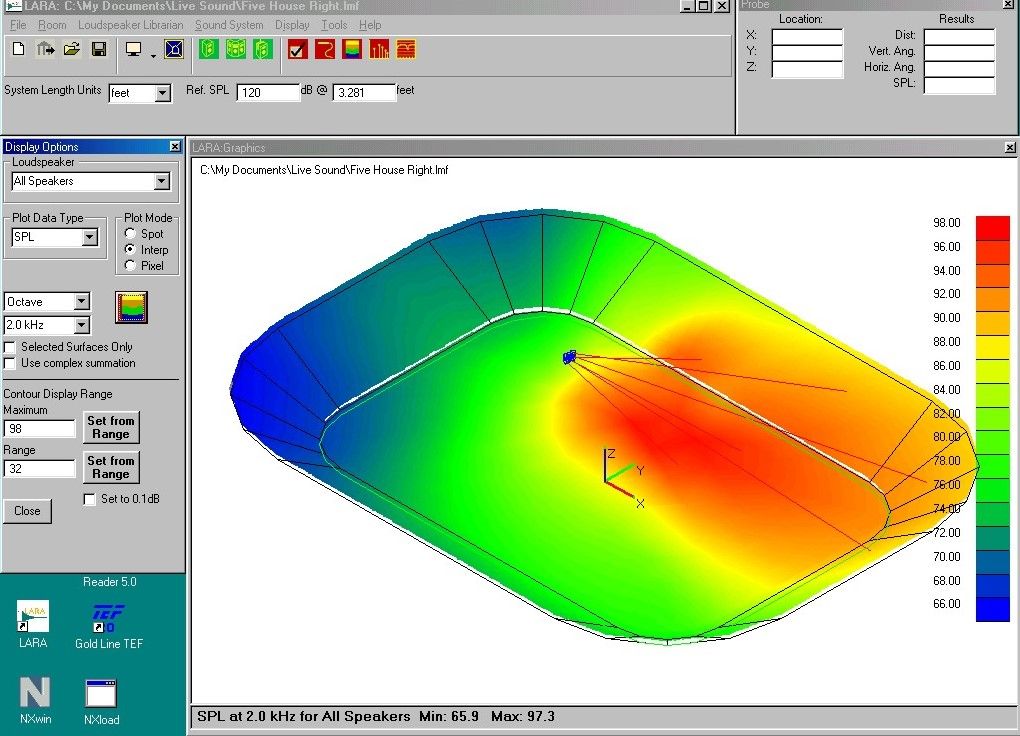
The program generates a color SPL map of the room at chosen frequencies. Audience surfaces can be chosen so that the model only shows coverage where the people are. (See Figure 1.4) Or we can look at all surfaces so that sound can be steered away from non-audience areas to minimize the system’s interaction with the room. Individual cabinets or clusters can be turned on or off to see what contribution to the overall coverage is being provided by them. In addition to SPL maps the program will provide complex summation maps. These show the constructive and destructive interference patterns that are produced by overlapping coverage patterns. This enables you to see comb filters and the lobing they produce. (See Figure 1.5)
Unfortunately for us Mac guys most of these programs are only available for the Windows world. But most of us have been forced to have at least one foot in the PC camp by now anyway. These types of tools keep coming along to make our jobs more complicated in some ways but simpler in others. And if we can hang the PA right the first time we can spend our day tuning, tweaking and sound checking. But the bottom line is better sounding shows with more even coverage through the whole venue. And that’s what its all about, isn’t it? Besides, all this computer modeling will keep us out of the back room on the bus!;-)
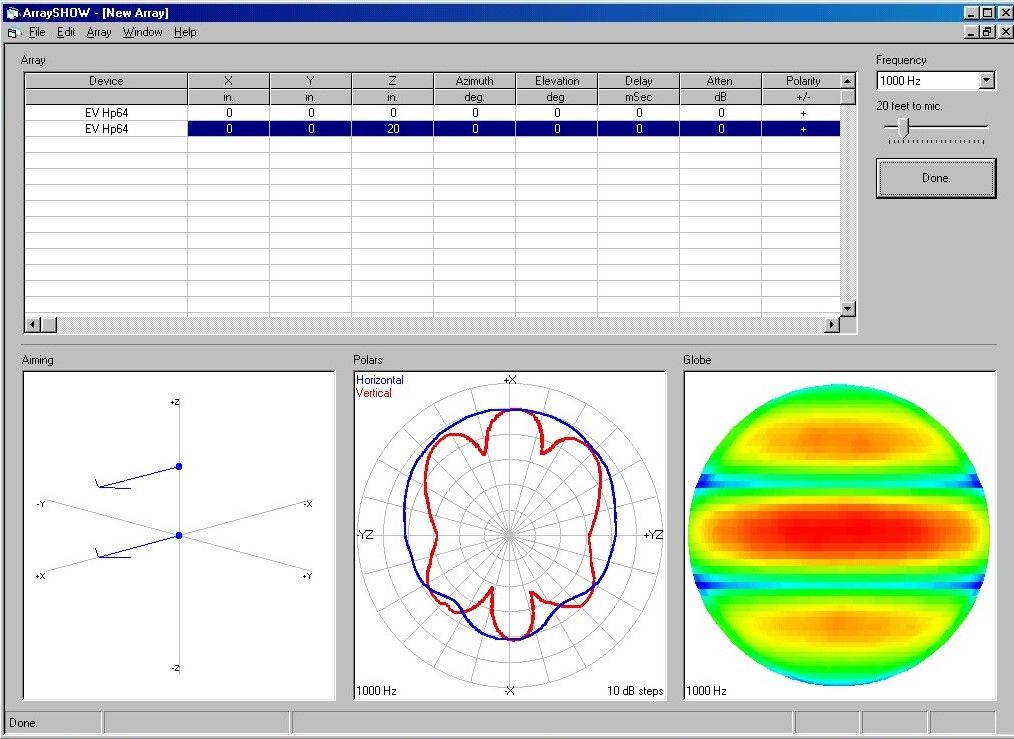
ArrayShow
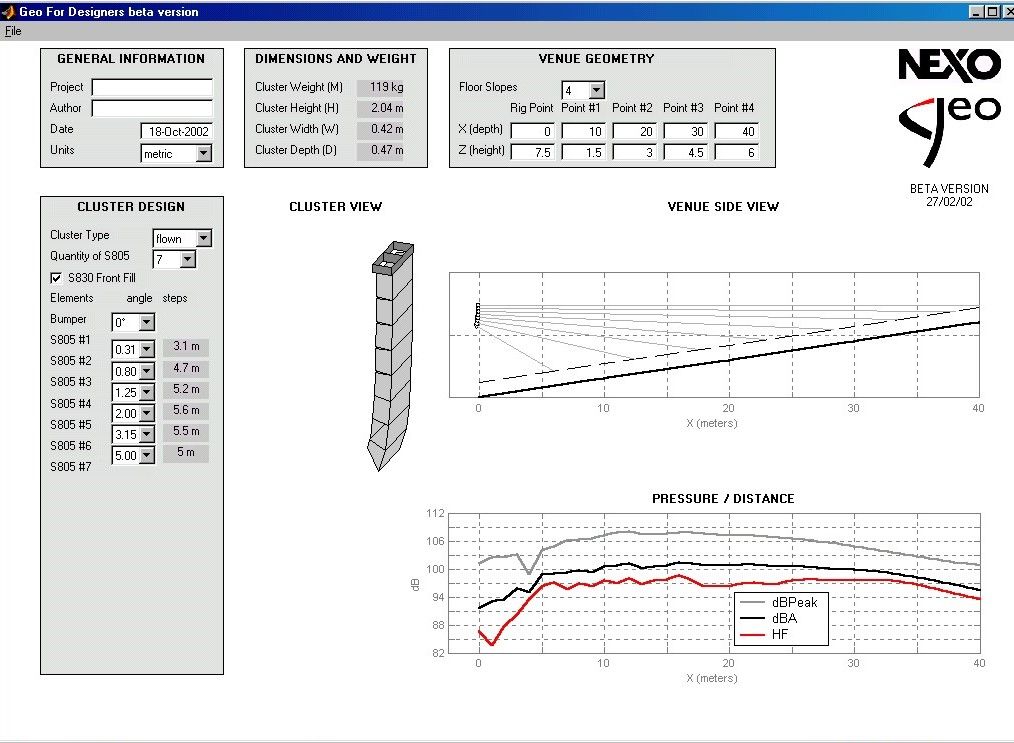
Line Array Software

Speaker Location & Aiming
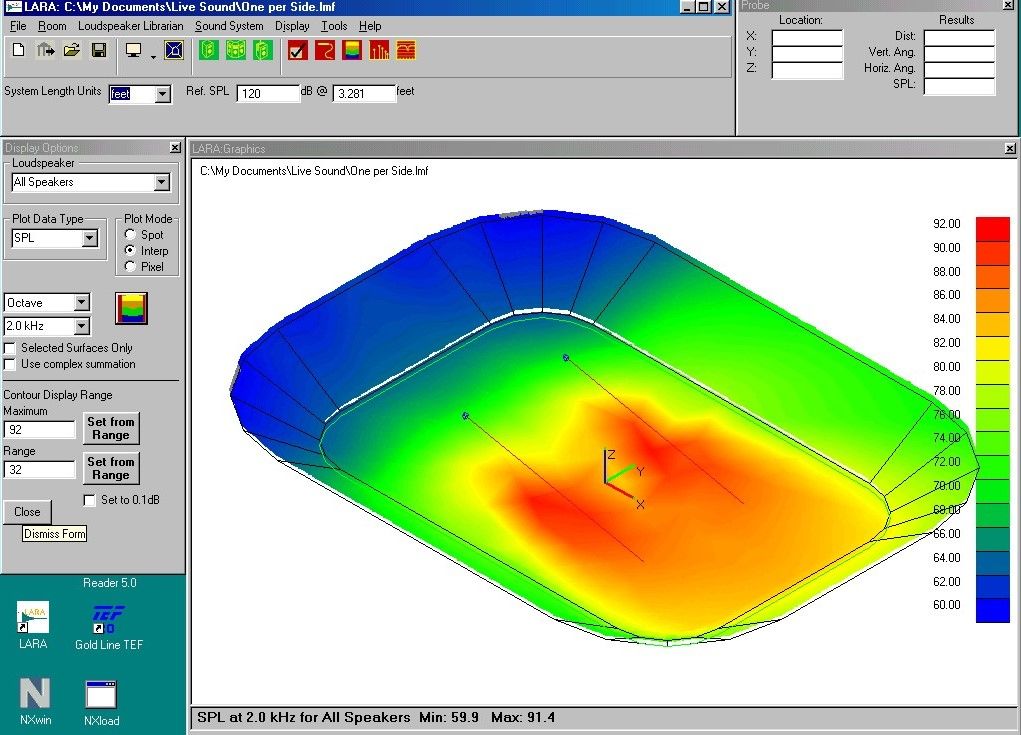
One Speaker Per Side @ 2KHz

One Speaker Per Side @ 250Hz-Complex Summation
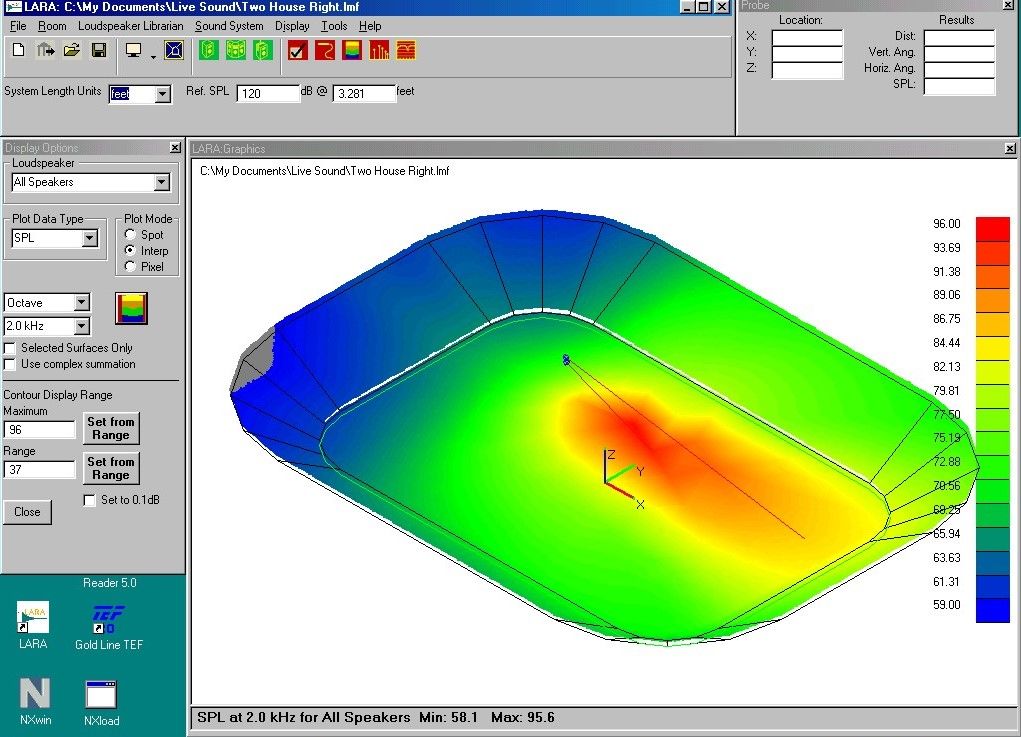
Two Speakers House Right

Four Speakers House Right

Six Speakers House Right
Six Speakers House Right-Level Corrected